Contact Us
Contact:
Robin Beads
Associate Director, Institutional Research
Leonard, Room 1st floor on a map
Institutional Rsch / Assessmt 4400 Massachusetts Avenue NW Washington, DC 20016-8059 United StatesOIRA Surveys
The Office of Institutional Research and Assessment has developed a comprehensive survey program designed to gather information about student backgrounds, and their experiences while enrolled and after they graduate from American University. In addition, student satisfaction and evaluation information are also collected. Below, there are descriptions of each of the surveys that are a part of the program.
All first-time first years are asked to complete the Summer Transition Survey during their first weeks at American University. The survey asked about students' initial impressions about AU, their decision to come to AU, and their expectations for academic and social life.
Summer Transition Survey 2023 Highlights
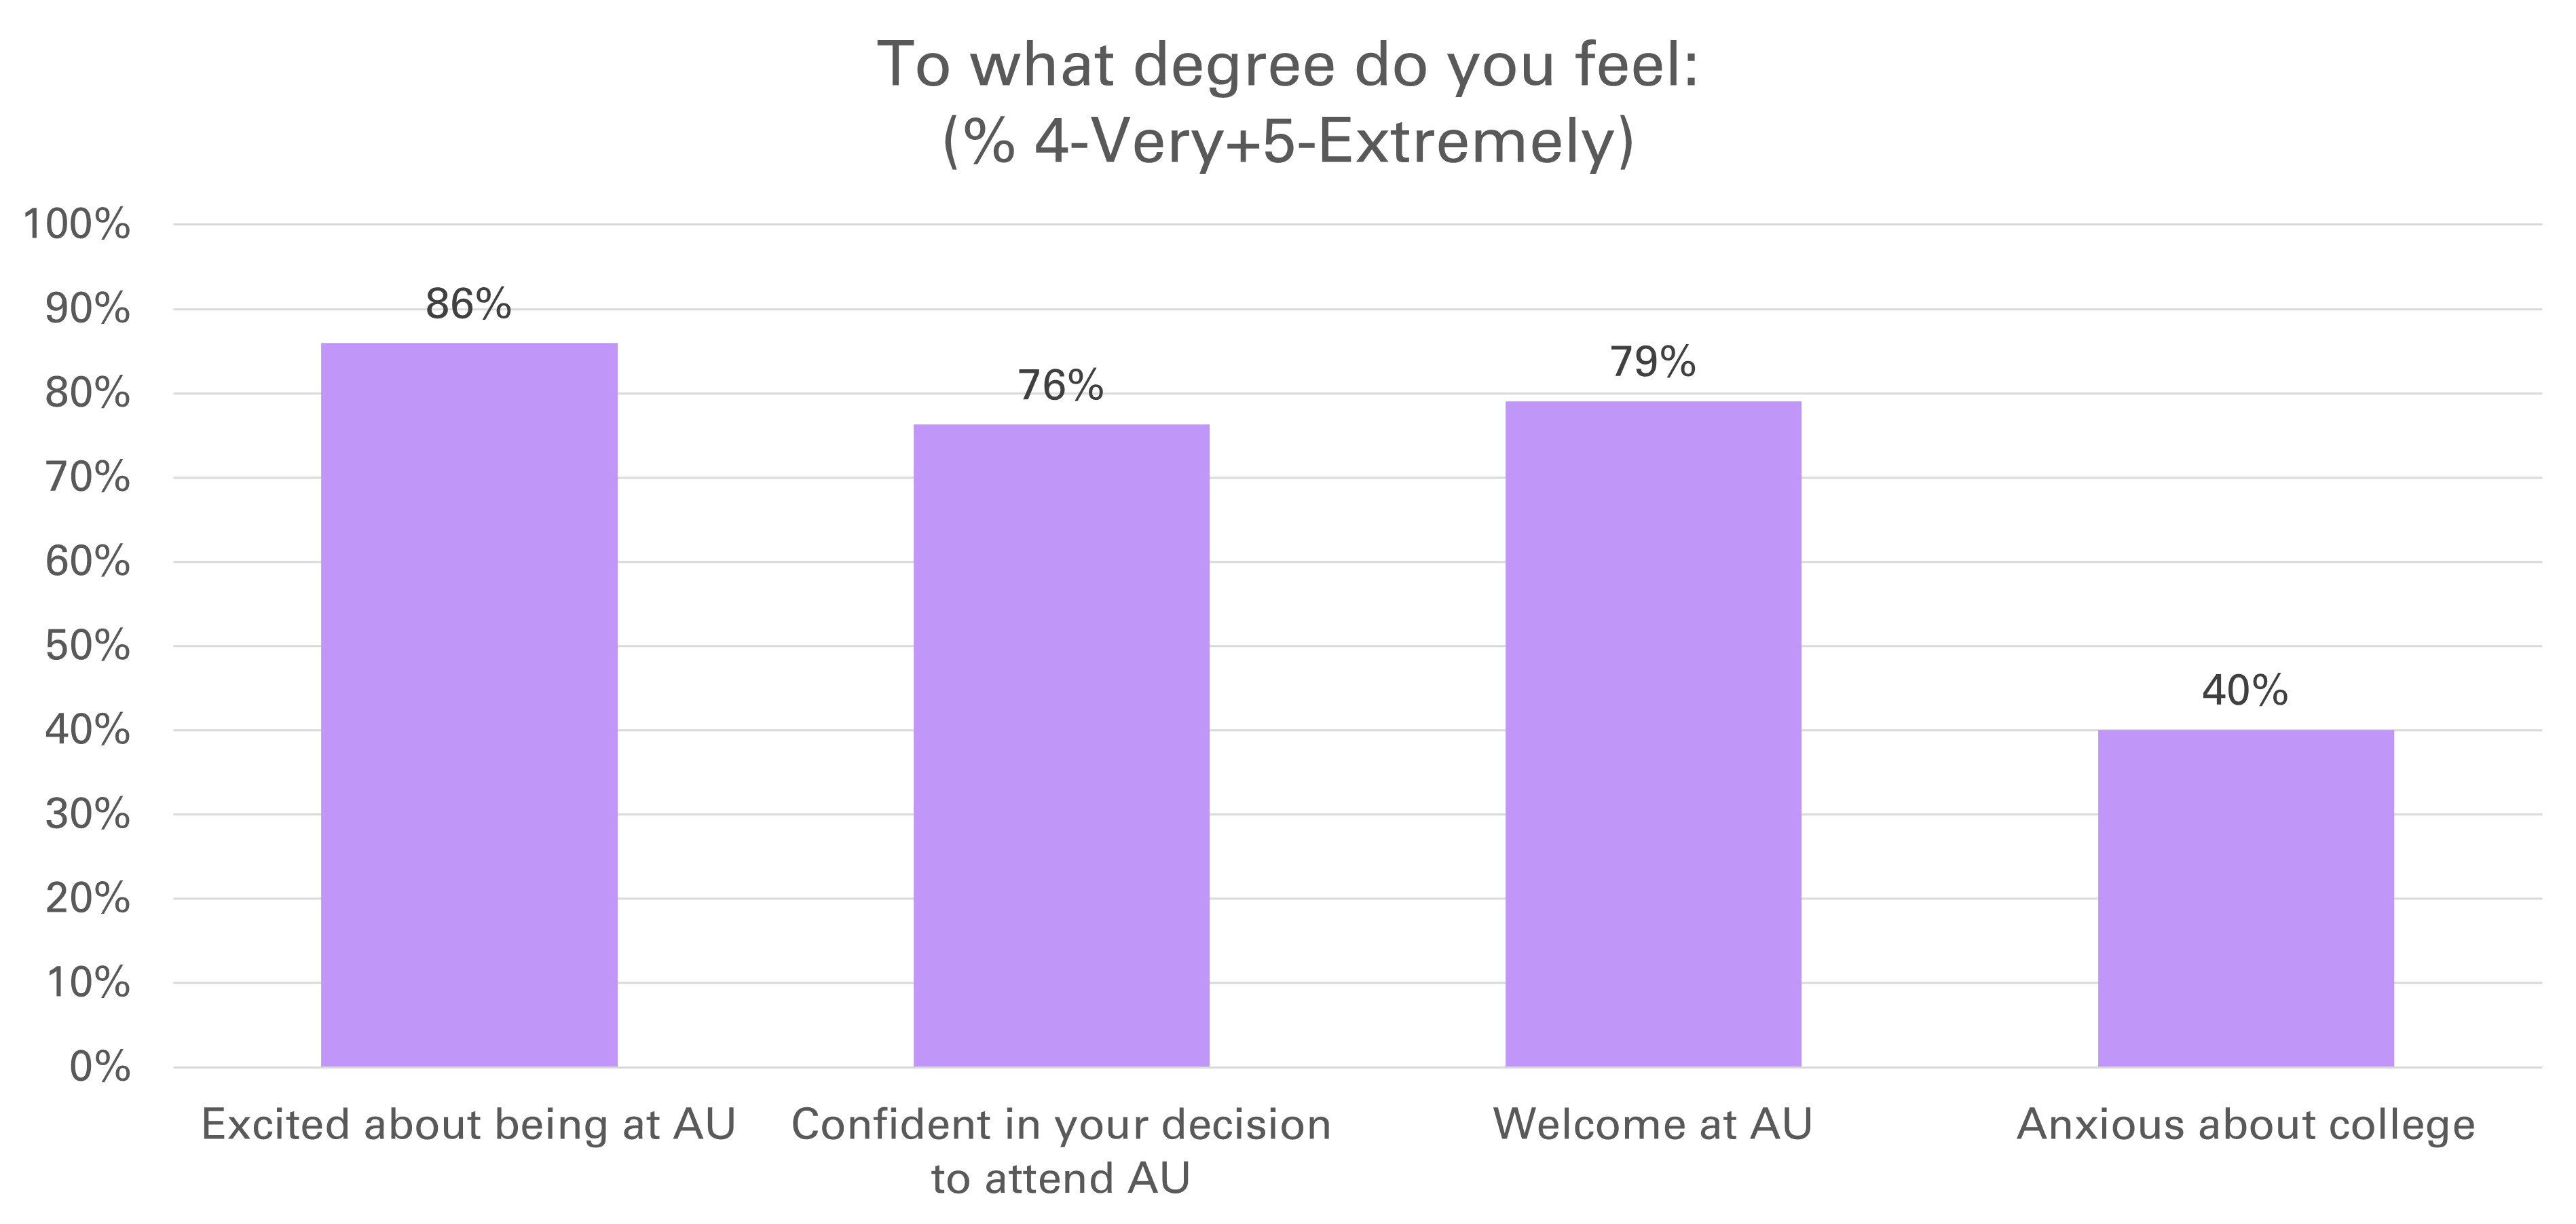 Many new students expressed high excitement (86%) and high confidence (76%) about their decision to attend AU. 79% felt highly welcomed at AU. 40% also reported feeling highly anxious about college. A high level is indicated by selecting 4 or 5 on a five-point scale: 1 - Not at all, 2 - Somewhat, 3 - Moderately, 4 - Very, 5 - Extremely.
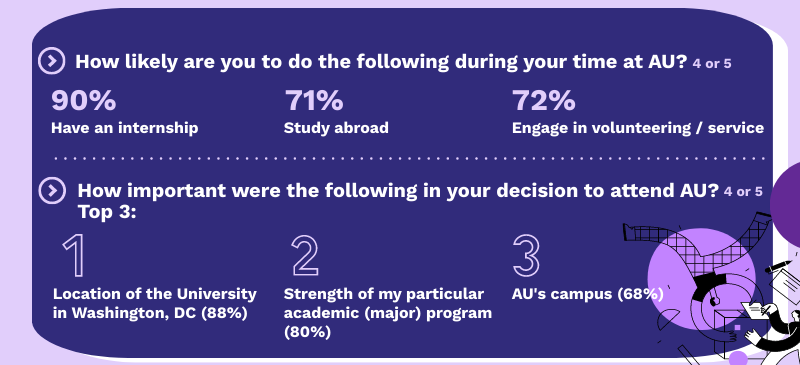 Respondents were highly likely to have an internship (90%), study abroad (71%) and engage in volunteering/service (72%) during their time at AU. The top three factors were highly important in respondents' decision to attend AU: Location of the university in Washington, DC (88%), strength of their particular academic (major) program (80%) and AU's campus (68%). A high level is indicated by selecting 4 or 5 on a five-point scale: 1 - Not at all, 2 - Somewhat, 3 - Moderately, 4 - Very, 5 - Extremely.
The Campus Climate Survey, conducted by the Office of Institutional Research and Assessment since 1992, collects data about student satisfaction with various aspects of campus life. The survey was substantially revised in 2017, and was most recently administered in February 2023. This survey is comprised of two versions: one for degree-seeking undergraduates and another for degree-seeking graduate students.
Campus Climate Survey Highlights 2023
Undergraduates
Responses were rated on a 5-point scale. Responses below described as "nearly always" are those indicating 4 - Most of the Time or 5 - Almost Always.
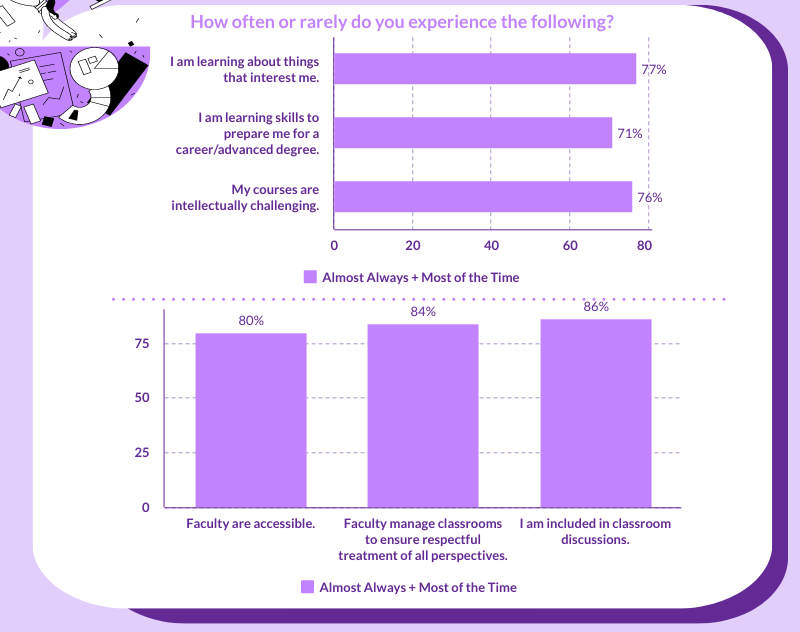 In 2023, results pertaining to the undergraduate academic experience showed:
- 77% are nearly always learning things that interest them.
- 71% are nearly always learning skills to prepare them for a career/advanced degree.
- 76% feel their courses are nearly always intellectually challenging.
- 80% of respondents find faculty are nearly always accessible.
- 84% find faculty nearly always manage classrooms to ensure respectful treatment of all perspectives.
- 86% nearly always feel included in classroom discussions.
The National Survey of Student Engagement (NSSE), based at the Indiana University Center for Postsecondary Research, asks students at hundreds of colleges and universities to reflect on the time they devote to various learning activities. The topics explored are linked to previous research on student success in college. The survey is administered to new first-year students and seniors.
What is engagement, according to NSSE?
Student engagement represents two critical features of collegiate quality. The first is the amount of time and effort students put into their studies and other educationally purposeful activities. The second is how the institution deploys its resources and organizes the curriculum and other learning opportunities to get students to participate in activities that decades of research studies show are linked to student learning.
American University participates in NSSE every other year, most recently in Spring 2023, as one of 541 participating institutions.
NSSE 2023 Highlights
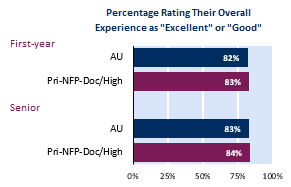
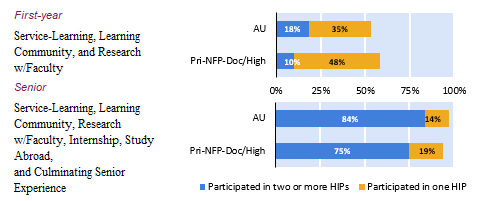
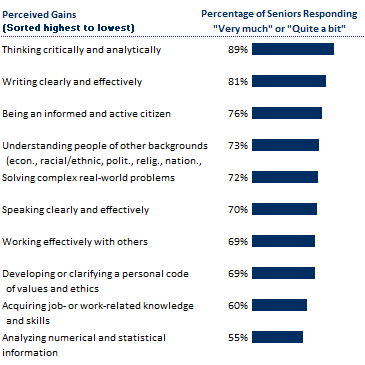
You can contact the Office of Institutional Research and Assessment at oira@american.edu for more information, or visit https://nsse.indiana.edu.
The Graduation Census is administered to all undergraduate and graduate students who apply for graduation and ending six months after commencement. It gathers information about students' post-graduation employment and graduate school plans, as well as their level of satisfaction with their academic program and overall experience at AU. Additionally, the Graduation Census inquires about students' participation in activities such as internships, study abroad, and community service.
Graduation Census Highlights - Six Months after Graduation in Spring 2023
Bachelor's Degree Alumni
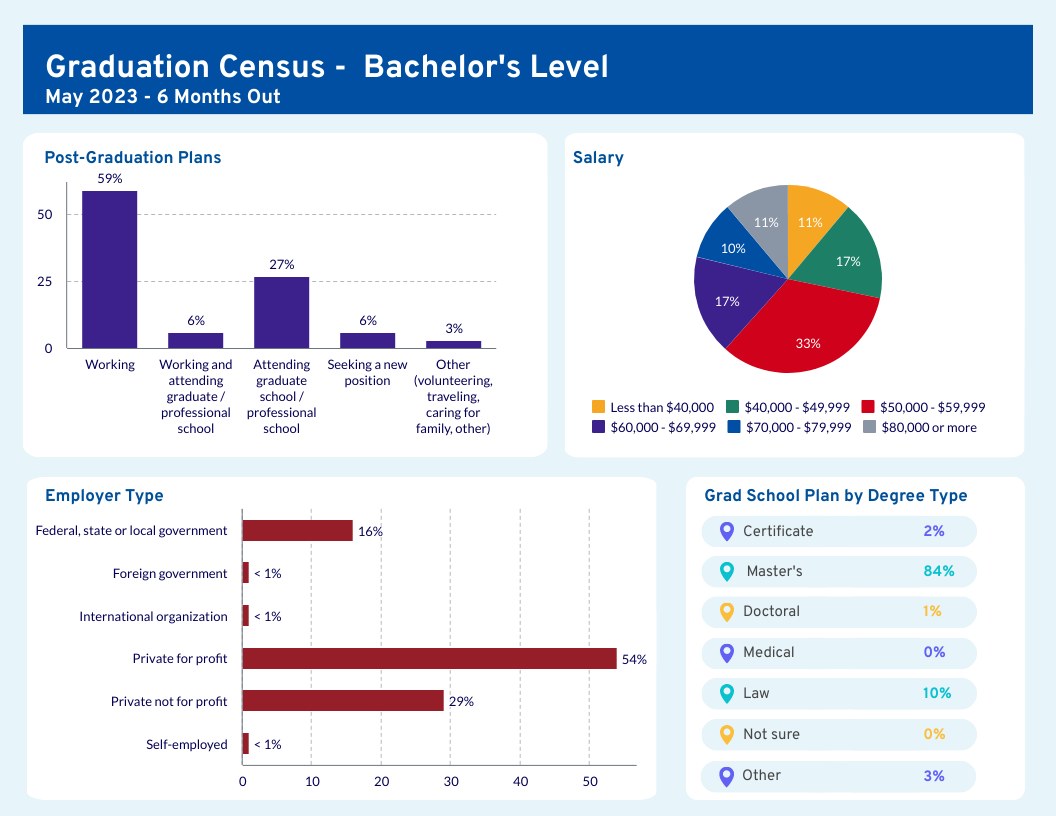
- Post-Graduation Plans: 91% of AU bachelor's degree alumni respondents were working (59%), attending graduate school (27%), or both (6%); the remaining were seeking a new position (6%) or indicated other (3%). The other category includes involvement in activities such as volunteering, traveling, or caring for family.
- Salary: 72% of respondents reported their annual salary was $50,000 or above (33% reported $50,000 to $59,999, 17% reported $60,000 to $69,999, 10% reported $70,000 to $79,999, and 11% reported $80,000 or more). Only 17% reported $40,000 to $49,999, and the remaining 11% reported less than $40,000. Salary information is only for respondents who reported full-time employment.
- Employer Type: 54% of respondents reported working in private for-profit organizations, 29% in private not-for-profit institutions, and 16% in federal, state, or local government roles. Less than 1% are employed by foreign governments, international organizations, or are self-employed.
- Graduate School Plan by Type of Degree: Of those already accepted into graduate school, 84% of respondents will pursue master's degrees and 10% law degrees. Additionally, 2% will pursue certificates, 1% doctoral degrees, and 3% other types of degrees.
Master's Degree Alumni
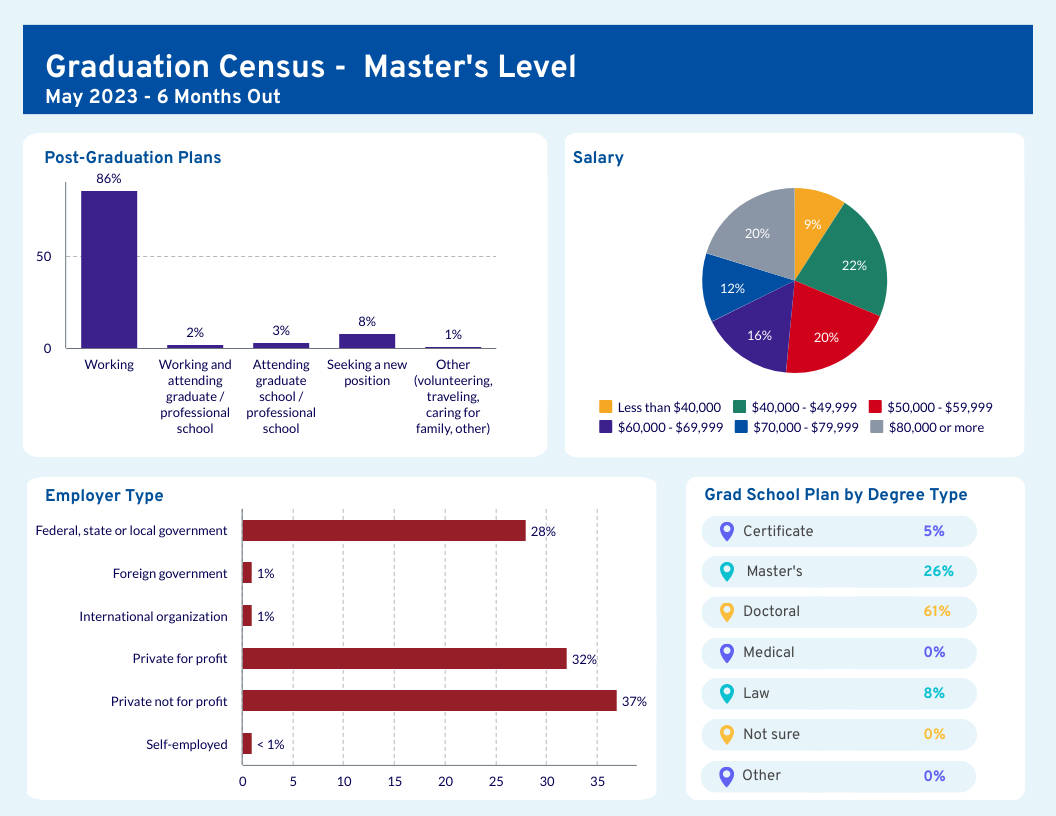
- Post-Graduation Plans: 91% of AU master's degree alumni respondents were working (86%), attending graduate school (3%), or both (2%); the remaining were seeking a new position (8%) or indicated other (1%). The other category includes involvement in activities such as volunteering, traveling, or caring for family.
- Salary: 69% of respondents reported their annual salary was $60,000 or above (20% reported $60,000 to $69,999, 16% reported $70,000 to $79,999, 12% reported $80,000 to $89,999, and 20% reported $90,000 or more). Only 22% reported $50,000 to $59,999, and the remaining 9% reported less than $50,000. Salary information is only for respondents who reported full-time employment.
- Employer Type: The majority of respondents (37%) reported working in private not-for-profit institutions, followed by 32% in private for-profit organizations. Additionally, 28% were employed in federal, state, or local government roles. A smaller portion, constituting 1% each, indicated employment within foreign governments or international organizations. The remaining less than 1% are self-employed.
- Graduate School Plan by Type of Degree: Of those already accepted into graduate school, 61% will pursue doctoral degrees, 26% master's degrees, and 8% law degrees. Another 5% will pursue certificates.
For more detailed results, please visit We Know Success, where you can filter results by school and program.
Surveys @ AU
David Kaib, the Assistant Director of Institutional Research and Assessment, coordinates survey research activity on campus. If you are interested in surveying members of the AU community, please contact David at dkaib@american.edu as soon as possible prior to conducting your research.
If your survey is for research purposes, as opposed to assessing your services or program, you may need to submit your proposal to the Institutional Review Board (IRB) prior to conducting your research. To learn more about the IRB, what types of research require IRB proposal or to submit a proposal, please go to the Institutional Review Board.
