
Media Inquiries?
For quotes or to request an interview, please contact an AU Public Relations Manager at:

KSB - Kogod School of Business on a map
4400 Massachusetts Avenue NW Washington, DC 20016 United StatesThe Kogod School of Business established its Business in the Capital Initiative to provide insight on key regional issues and start productive conversations about improving the greater Washington business climate. Kogod is committed to sharing its research and expertise with policy makers and business leaders to build the greater Washington area economy.
The Business in the Capital Initiative also benefits the future business leaders we are training in our classrooms. As the DC area's oldest business school, Kogod has been educating students for over 75 years, many of whom stay and contribute to the regional economy. The Business in the Capital programs-research papers, industry discussions, speakers and events-create even stronger bonds between our business school and local businesses in order to better prepare our students to work in Washington and the world.

For the third year in a row, the greater Washington area scored well above-average in attractiveness to Millennials, moving up slightly to 127—27% above the national average across the 33 factors we measured. The region continues to shine on jobs and salaries, the most important criteria Millennials use when deciding where to live and work. With great amenities like museums, restaurants, public transportation and easy travel to other cities, Washington continues to be an attractive option to Millennials looking for a place to start or continue their careers. Compared to the top 20 metropolitan areas in the country, Washington maintained its number two spot behind San Francisco despite huge gains made by both Seattle and Denver this year.
While Washington continues to score high on the Millennial Index, clouds are visible on the horizon. For the first time since the financial crisis and recession (when Washington preserved jobs while unemployment skyrocketed elsewhere), the region experienced a small net-outflow of Millennials in 2016, raising questions about what will happen in the future. Washington area Millennials have consistently shown concern over the three C's-costs, commutes and crime-concerns that increase as they move from their carefree, career-focused single days to a more sober, settled-down life with a family, a mortgage, and childcare payments. Only a small percentage of Millennials are fully committed to staying in the region, and many are already planning to move away, often to a place that's more affordable, less hectic and with less traffic.
Can the Washington area keep its Millennials? This year's research focused on answering that question. Many Washington area Millennials are satisfied with the seven aspects of their lives we queried, yet half of them are likely to move within the next three to five years. Only a very small percentage say they are being pushed away by high costs, limited housing choices and bad traffic, yet those items are top-of-mind when Millennials are asked about the downsides of the region. The reality seems to be that Washington is not a long-term fit for many Millennials, but rather a stepping stone in their career, or just one of many cities they plan to experience before they settle down. Still, Millennials say they can be enticed to stay in the Washington area with higher salaries; higher job satisfaction; opportunities for ongoing training, education and career growth; the option to regularly telecommute (and avoid traffic!); more family-friendly policies at work; and better schools for their children.
Overall, the Washington region is attractive to Millennials, but its lead versus other major metros has eroded as other cities have fully recovered from the recession. Millennials now have more choices for their next career move, and many of those currently living in the Washington area are itching to go somewhere else, either warmer, more affordable, less crowded, in the mountains, near a beach, with a bigger entertainment scene or just closer to home. Those considering a move to Washington will likely have options in other cities as well, most of which have faster commutes and lower housing prices than Washington. At the same time, Millennials are steadily approaching middle age (the oldest Millennials are now 37) and slowly shifting their priorities from career to family, from amenities to savings. The Kogod Millennial Index survey and report provide solid insight into what is important to this critical generation, how they feel about their lives in the Washington region today, and where employers and government leaders should focus their efforts to maintain the area's attractiveness.

Millennials are now the largest living generation in the United States, numbering around 80 million. Born roughly between 1980 and the late 1990’s (there is no single accepted date range), the oldest Millennials are now in their mid-thirties. They have steadily become the core of the American workforce, officially passing Baby Boomers as the largest segment of American workers in 2015. By 2025—just seven short years away—Millennials are expected to comprise 75% of the workforce. Clearly they are an important group!
When Millennials first started working they were seen almost as an alien species. They were accused of being lazy, narcissistic and slow to grow up, contentedly living with their parents and putting off marriage, children and big purchases like houses and cars. Managers from the Baby Boomer and Generation X cohorts complained about Millennials questioning authority, seeking praise, demanding raises and hopping from job to job chasing crazy workplace perks like foosball tables and napping pods. Slowly, however, the critiques have faded and a more realistic picture of Millennials has emerged.
As it turns out, Millennials are not fundamentally different from prior generations in terms of what they want. Our research on Washington area Millennials has shown that they care the most about having a steady job with a good salary, being able to get to and from work in a reasonable amount of time, and finding a safe and enjoyable place to live – goals reminiscent of their parents and grandparents. As they move into their 30’s, the Millennials we surveyed increasingly turn their attention to getting married, buying a house, having children and saving for retirement, all very “traditional” pursuits. What’s stopping them, in many cases, is the financial reality of recession-dampened wages, hefty student loan debts and a steadily increasing cost of living.
Still, Millennials are different in important ways. They are the most diverse generation in history, with 44% identifying as non-white, and they are the most educated: one-third of those over 25 hold a Bachelor’s degree. Millennials are also more urban, whether by choice (they are very social and experience-oriented) or by necessity (the country was in recession when many of them graduated, and cities had more and higher-paying jobs). Citylab estimated that 25-34 year olds were 51% more likely to live in urban core neighborhoods in 2010, and those with a college degree were 100% more likely to be urbanites.
Millennials are also the first digital natives, having come of age as smart phones and apps began to make everything faster and easier. They have integrated technology into how they live and socialize, and they expect their workplaces to be just as tech-enabled, efficient and transparent. Millennials tend to blur the lines between work and life, seamlessly shifting between checking social media and answering work emails day and night, weekday and weekend. Rather than being lazy, several studies have found that Millennials tend to be bigger “work martyrs,” more competitive on the job, and more likely to forfeit vacation time than workers from older generations.
Millennials, now half of the American workforce, are no longer an anomaly. They are quickly becoming the managers, leaders, homeowners and taxpayers that companies and jurisdictions will depend on for decades to come, so it is more critical than ever to truly understand what Millennials value and want as they move from their carefree early 20’s into and through their 30’s.
Greater Washington Millennial Index
Dawn Leijon
Lead Researcher, Executive-In-Residence
Kogod School of Business at American University
Erran Carmel
Professor and Director, Business in the Capital Initiative Research
Kogod School of Business at American University
Supanuch Boonchuwong
Research Assistant, MS in Marketing Candidate
Kogod School of Business at American University
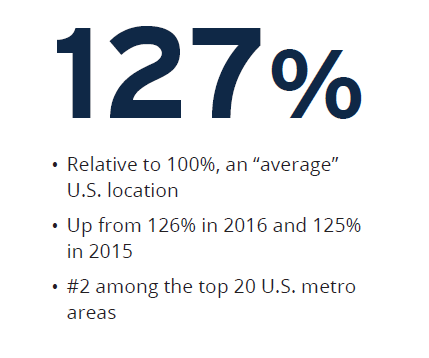
For the third year in a row, the greater Washington area scored well above average on what Millennials look for in a place to live and work, with an overall index score of 127%. The 2017 index is one point higher than 2016 (126%) and two points higher than 2015 (125%).
The Millennial Index assesses how well the Washington area delivers against 33 factors Millennials care about. The base is 100%, which represents the average national score on all factors. Thus, with a 127% index for 2017, Washington is 27% more attractive to Millennials than an average location.
The one point improvement comes largely from continued above-average performance on employment and salaries, two factors that together make up 18% of the total index score. The cost of housing, which accounts for another 5% of the total index score, also improved slightly compared to the national average in 2016. While absolute rents and home prices in the region continued to climb, they rose more slowly than the rest of the country, helping to keep the index score high.
The Millennial index is designed as an easy way to judge the attractiveness of the Washington area to the Millennials living here. By collapsing data from five major categories and 33 individual factors into one metric, we can easily track changes from year to year and compare Washington to other cities.
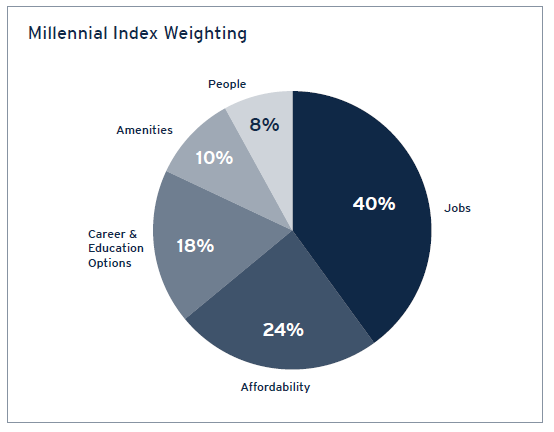
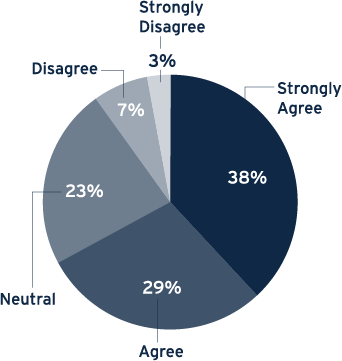
The pie chart shows the relative importance Millennials assigned to each of the five major categories in 2017. The weights have been consistent since we launched the index, with Jobs and Affordability together equaling almost two-thirds of the overall calculation. Long-term career and education options claim the middle spot, only half as important as Jobs but as important as Amenities and People put together. The incredible consistency from year to year reinforces the validity of the Millennial Index as an accurate measure of what is most important to local Millennials.
Once again, a major contributor to the Washington region's above-average attractiveness is its strong delivery on Jobs-the most important factor and one where the region has been strong. The 2017 delivery score is a hefty 141% (41% better than the national average on job-related factors), but three points lower than 2015 and two points lower than 2016. Continued erosion on this huge factor is concerning and may lead to a declining score for the Washington region in the future.
Affordability is the second highest priority for Millennials and, like most cities, the greater Washington area scores well below national averages for cost of living factors such as housing, groceries, utilities, child care and services. For 2017, Washington’s delivery score on Affordability is 91%, down two points from 2016. Overall, costs in the greater Washington area over the last several years have kept pace with national inflation rather than outpacing it, keeping the delivery score relatively constant.
Career options account for 18% of the overall index, and the greater Washington area remains well above average with a delivery score of 132%. The score declined three points from 2016 due to slightly lower scores on venture capital available for start-ups, the number of people studying in graduate programs and the proportion of professional jobs in the region.
The Amenities and People categories continue to be of relatively low importance to Millennials, despite those factors being the ones most visible and most often discussed in the media. The Amenities score jumped significantly this year due to a change in the way crime statistics were measured. In the past, we were forced to rely on incomplete data that weighted urban areas too heavily. For the 2017 index, we had complete data for the entire metropolitan statistical area, which lowered the crime rate and brought the Amenities delivery score up from 121% to 143%. The impact to the total Millennial index score was minor given the low weight assigned to the Amenities category and the large number of factors (seven) sharing that weight. The People category continued to deliver at 137%, well above the national average but of minor importance to the overall score calculation because of its small weight.
When calculating the Millennial Index, we use data from our entire survey sample, which includes people of all races, genders, education levels, incomes and geographies within the Washington metropolitan statistical area. The average weights assigned to the five categories were discussed above: Jobs is the most important consideration when deciding on a place to live and work, Affordability is number two, and People is relatively insignificant. The question is whether everyone assigns the same importance to each category, or if there are differences among sub-groups that can help us understand their situations and attitudes.
The Washington region became a darling of Millennials starting in 2008 when the financial crisis and resulting recession led to huge job losses and unemployment across the country. Washington’s economy, buoyed by federal spending, fared better than other cities, only losing 2% of its jobs in 2009 compared to almost 5% nationwide. Millennials leaving college needed jobs and Washington had them. The influx of educated twenty-somethings over the last decade helped revitalize the city, spurring development and resulting in new and better amenities that in turn made the city even more attractive. Washington was Bon Appetit’s Restaurant City of the Year for 2016, and in 2017, for the second year in a row, Niche.com rated Arlington, Virginia, its number one city for Millennials.
Despite all the success the city has enjoyed, there may be clouds on the horizon. In a July 2017 report titled The Washington Region’s Declining Economic Brand, economist Stephen S. Fuller noted, “The quality-of-life offered by the Washington region has become increasingly less competitive with the nation’s other major metropolitan areas.” His argument is two-fold: the regional economy has been slowing down since federal spending was cut in 2010, and the region, which has absorbed an additional three-quarters of a million people since 2008, is increasingly unattractive with high costs, high housing prices and terrible traffic.
The findings of our first two Millennial Index studies confirm Fuller’s sense of growing unattractiveness. When asked about the worst part of living in the region, high house prices and slow traffic topped the list, often accompanied with adjectives showing their frustration: atrocious, miserable, horrific, nightmare, insane, impossible. Yet Millennials continued to live in the region, with newcomers replacing those who left. Why? Jobs and salaries. When surveyed, Millennials consistently say that having a job is their top criteria for where to live, with salaries close behind. Throughout the economic recovery, Washington’s unemployment was among the lowest of any major city and the salaries were second highest in the nation, just slightly below San Francisco. Those two factors alone were enough to attract Millennial job seekers looking to start or advance their careers.
In 2017, Washington’s job and salary outlook remain strong, but it appears that we have entered a new era. At the end of 2016 there were 0.2% fewer 25-34 year-old Millennials in the Washington metropolitan area despite a 1.5% increase nationwide. Washington is no longer getting its fair share of Millennials, let alone more than its fair share as it did back in 2009. Millennials are leaving Washington, or never coming here in the first place. Many Millennials, who are young, educated and up for adventure, are not tied to where they grew up, so their consideration set is national when they think about where to live. While Washington is still attractive, it is no longer the only option with enticing amenities and abundant jobs.
There are three possible reasons for the shift in the Washington area’s attractiveness: 1. The Washington region has changed for the worse on an absolute basis 2. Other metro areas have improved, closing the attractiveness gap with Washington 3. Millennials have changed what they look for in a city and Washington no longer fits their needs
Fuller makes a strong case for the first point. According to his analysis of the top 15 metro areas pre- and post-recession, the Washington region’s rank declined on 13 out of 18 measures of economic growth, wealth, costs and quality of life, and only improved on one. The Washington area economy has grown at less than 1% since the 2010 federal spending cut when almost 13,000 jobs were lost. While the region has continued to see job growth, the mix has shifted from professional jobs with $100,000+ salaries to lower paid jobs in healthcare, hospitality and retail. At the same time, Washington is among the most expensive rental markets in the country. All these factors contributed to a paltry 1% growth in real per capita personal income from 2008 to 2015. Salaries may be rising, but costs are eating up most of those gains.
Despite the poor economic trends of the last few years, our Millennial Index research has found Washington to be very attractive to the Millennials living here. We have noted, however, that Millennials’ rising frustration with Washington (particularly with the three C’s of costs, commute and crime), combined with improving economies and opportunities in other major cities, may lead Millennials to vote with their feet and leave the area. Fuller’s analysis shows that the momentum is now elsewhere, lending support to the second explanation above. From 2010 to 2016, Boston’s economy grew twice as fast as Washington’s; Atlanta’s three times; Seattle’s four times; and Houston and Dallas both grew their economies five times faster than our region. Washington’s meager 1% growth in real per capita personal income (which factors in costs and inflation) was dwarfed by the gains in San Francisco (+14%), Detroit (+13%) and Boston (+11%). Indeed, while the Washington area suffered a net loss of Millennials in 2016, Phoenix, Dallas, San Francisco, Atlanta, Detroit and Seattle all saw a 2-4% increase.
The final explanation for why Washington may be losing Millennials can be summed up with the old cliché “It’s not you, it’s me.” Although we tend to think of Millennials as a homogenous block of people and attitudes, in reality it’s a large generation spanning twenty birth years, and the oldest Millennials are now inching closer to middle age and the traditional pursuits of marriage and family. Back in 2008, the oldest Millennials were only 28 and the majority were still in high school or college. It’s easy to understand the attraction of a job with a high salary to educated twenty-somethings who were ready to explore the world, or the necessity of such to those graduating in the middle of a recession with hefty student loan payments. Washington has been successful in attracting Millennials because it had what they were looking for, and as the city developed to meet Millennial interests—great restaurants, luxury apartments, cool events – it continued to be attractive to recent grads and twenty-somethings looking to build their careers and enjoy their lives.
The question is whether Washington remains attractive to Millennials as they enter the new life-stage of raising children. In last year’s report we analyzed the difference between Millennials who are single, those who are coupled up (living with a spouse or significant other), and those who have children. The differences were dramatic. As Millennials turn from the freedom and exuberance of their early working lives to the sober reality of “settling down,” their priorities change. Amenities like restaurants and bars take a back seat to work/life balance issues such as commute times and how many hours they need to spend at work. In terms of goals, buying a house becomes a priority as does saving for retirement. Given the high cost of housing in the Washington region and the terrible traffic one must endure if moving to a suburban or exurban neighborhood offering both safety and affordability, it’s not hard to see why older Millennials may reassess their connection to the Washington region. That connection is already tenuous since less than 45% of the Millennials we’ve surveyed over the years grew up in this area. Not only are the majority of Millennials missing deep family roots that might keep them here despite traffic and high costs, they likely have some motivation to move away from the region to be closer to Grandma and her free babysitting services.
The recent loss of Millennials in the Washington region is likely due to a combination of all three of the reasons outlined above. The more important questions, though, are WHY are they leaving and WHAT, if anything, can be done to keep them here. The Millennial Index is designed to answer these questions, and in this year’s survey we went deeper into who is planning to move and who is planning to stay, what is motivating them, and what might entice them to continue calling the Washington region home.
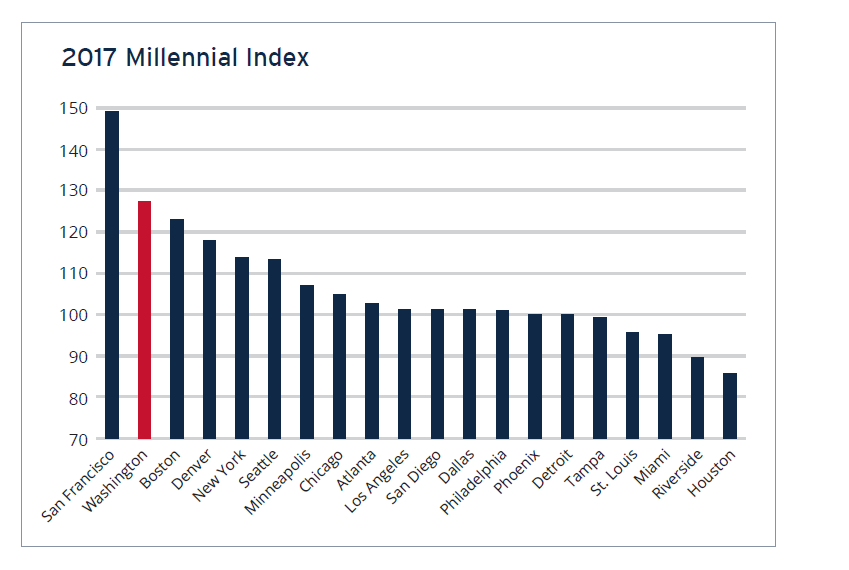
To provide context on how well Washington stacks up to other cities, we once again calculated a Millennial Index score for each of the top 20 metropolitan areas. These scores are based on what Washington area Millennials say is important to them. Therefore, the scores tell us which cities are most attractive-and therefore the biggest competitors-for our current and potential Millennial residents.
In 2017, Washington maintained its number two spot, despite significant changes in index scores among many of the cities. The number one spot is still held by San Francisco, which scores high on Jobs and Amenities factors. Its sustained attractiveness continues to attract newcomers, despite housing costs that are the highest in the country at 3.2 times the national average.
Boston continues in the number three spot after Washington, but its score dropped two points due largely to a slight uptick in unemployment compared to a national decrease. Last year Washington had only a slight edge over Boston in the Millennial Index, but the gap has now widened to three points.
The big news in this year's Top 20 rankings is the jump for Denver and Seattle. Denver catapulted over New York into the fourth spot and Seattle jumped over Chicago to come almost even with the Big Apple.
Denver benefited from a great job market, adding per capita jobs 82% faster than the national average in 2016 (continuing its strong growth of 102% above average in last year's index). Denver improved on the number of Millennials in the city, apartment availability, and unemployment, plus several cost of living factors.
Seattle was propelled by job growth, adding over twice as many jobs per capita as the national average. The city also saw increased numbers of students in graduate programs, venture capital funding, transit riders and short commutes, all making the city more attractive. So far the data does not show a significant increase in the overall cost of living, helping Seattle move up eight points in the index.
While job growth and total employment – both very important factors in the overall index score – helped propel many of the cities, they were responsible for pushing Houston down six points to the bottom spot on the list. Of the top 20 cities, Houston is the only one to lose jobs in 2016. Its score of 85 means that it is 15% less attractive than an average location, and 42% less attractive to Millennials than Washington.
| City | 2017 Millennial Index | Change from 2016 | Population Rank |
|---|---|---|---|
|
San Francisco |
149 |
-2 |
11 |
|
Washington |
127 |
+1 |
6 |
|
Boston |
123 |
-2 |
10 |
|
Denver |
118 |
+7 |
19 |
|
New York |
114 |
-- |
1 |
|
Seattle |
114 |
+8 |
15 |
|
Minneapolis |
107 |
+2 |
16 |
|
Chicago |
105 |
-1 |
3 |
|
Atlanta |
103 |
+4 |
9 |
|
Los Angeles |
102 |
+2 |
2 |
|
San Diego |
101 |
+1 |
17 |
|
San Diego |
101 |
+1 |
17 |
|
Dallas |
101 |
+1 |
4 |
|
Philadelphia |
101 |
+4 |
7 |
|
Phoenix |
100 |
+4 |
12 |
|
Detroit |
100 |
+6 |
14 |
|
Tampa |
99 |
+3 |
18 |
|
St. Louis |
95 |
-1 |
20 |
|
Miami |
95 |
-1 |
8 |
|
Riverside |
90 |
-2 |
13 |
|
Houston |
85 |
-6 |
5 |
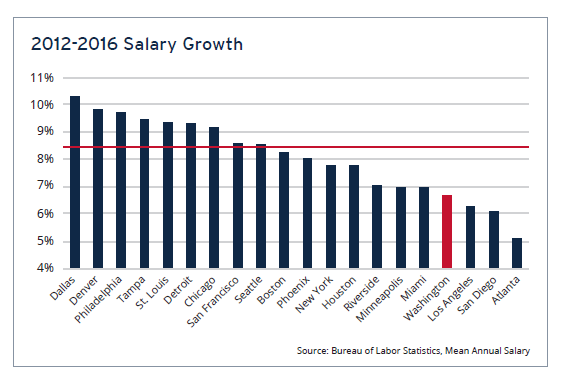
Salary level is the second most important factor in the Millennial Index, with almost half of respondents saying that salary levels are extremely important when they are deciding where to live and work. Due to the high percentage of professional jobs in the Washington region (33%, the highest of any city), salaries have consistently been above the national average. In the past three years, salary growth has outpaced the nation, helping add points to Washington's Millennial Index score. The average salary in Washington was 28% above the nation in 2014, 36% above in 2015 and 37% above in 2016. Washington's average salary is just 1.6% below San Francisco, but 6% higher than Boston and 10% higher than New York.
Salaries are easy for job seekers to compare across companies and geographies, and higher ones attract attention. Half of the Millennials we surveyed said they live in the Washington area because a job brought them here, and the high salaries offered in the region certainly added to the lure.
High salaries are arguably more important to Millennials than other generations. Costs have gone up across the country but wages have not kept pace. According to a Census bureau estimate, Millennials are making less in real dollars now than workers their age did in the 1980’s. On top of that, about half of them have student loan debts to repay. Among the Millennials we surveyed this year, 47% have student loans and a quarter of those are spending over $600 per month to repay them.
Millennials also spend differently from prior generations. A recent study by Charles Schwab found that Millennials are more likely than Gen Xers and Baby Boomers to spend money on taxis and Ubers, expensive coffee house drinks, the latest electronic gadget, eating at the hottest restaurants and going to see live events. They often prioritize convenience over cost saving, opting for grocery delivery, restaurant take out or meal kits shipped to their homes rather than buying and cooking groceries, paying a price premium of 15-100%. Add to that the challenge of paying the same amount as Gen Xers for fixed-price items like transportation, internet and cell phone service, but with much lower early-career incomes, and you see why Millennials need higher salaries just to survive with the basics.
The good news is that salaries in the Washington region are high and continue to increase faster than the rest of the nation, so this major source of attractiveness seems likely to continue. The four-year trend suggests much higher growth among other cities, but the data shows they actually had unusually low salaries to correct. For instance, after stellar four-year growth, Dallas just achieved 101% of the national average salary in 2016 while Tampa and St. Louis are still below it. Salaries in Philadelphia and Chicago are still only about 8% above the national average even though they are big cities, with a cost of living 14-17% higher than the national average.
| City | 2016 Average Salary | Versus National Average | |
|---|---|---|---|
| Source: Bureau of Labor Statistics | |||
|
San Francisco |
69,110 |
139% |
|
|
Washington |
68,000 |
137% |
|
|
Boston |
64,080 |
129% |
|
|
New York |
61,790 |
125% |
|
|
Seattle |
61,170 |
123% |
|
|
Denver |
55,910 |
113% |
|
|
Los Angeles |
55,650 |
112% |
|
|
San Diego |
55,480 |
112% |
|
|
Minneapolis |
55,010 |
111% |
|
|
Philadelphia |
53,450 |
108% |
|
|
Chicago |
53,320 |
107% |
|
|
Houston |
52,870 |
107% |
|
|
Detroit |
50,960 |
103% |
|
|
Atlanta |
50,720 |
102% |
|
|
Dallas |
50,350 |
101% |
|
|
St. Louis |
48,240 |
97% |
|
|
Phoenix |
47,540 |
96% |
|
|
Riverside |
46,820 |
94% |
|
|
Miami |
46,160 |
93% |
|
|
Tampa |
45,510 |
92% |
|
Besides traffic, the loudest complaints we see in our research are directed to the "unaffordable, atrocious, insane" house prices in the region. Housing costs fall slightly below the availability of jobs and salary levels in terms of importance, but they are a lightning rod of discontent and a major watch-out as Millennials grow older, get married and prepare to raise children.
For many years the theory was that Millennials were content to live in their parents' basements or rent apartments, and that they did not want to be tied down to a home. Recent home buying trends have disproven that myth. The reality is that Millennials want to buy homes, but their financial situation (post-recession wages, high cost of living, student loan debt) makes it hard for them to save enough for a down payment. Plus, Millennials prefer to live in urban settings with lots of amenities, and houses in those areas tend to be much pricier.
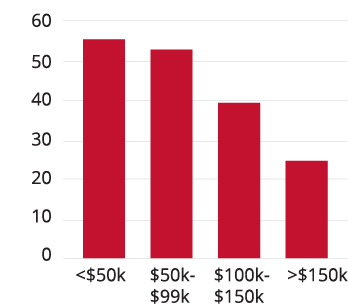
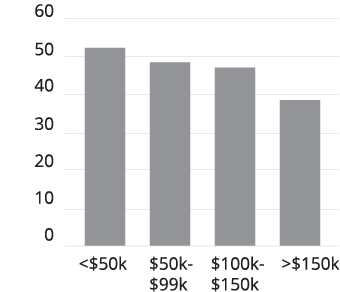
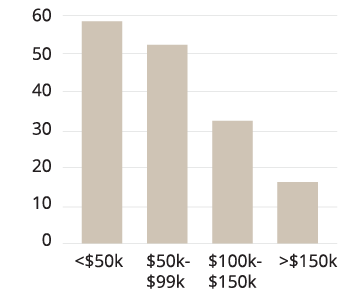
In this year's survey, we asked Washington area Millennials how they felt about home ownership and only 3% said they had no interest in owning a home. Almost 40% already own a home, with those over age 31 twice as likely to be homeowners as those under 31. The non-homeowners who want to own a home but do not divide like this:
Among the top 20 cities, Washington's median home price is not the worst - or even in the top five. Unfortunately, area Millennials are unlikely to look at this chart and feel better. Rather, they think about how much more house they could buy back home where they grew up, or they calculate how much they can afford given their salary and debts, and the prices look sky high. Even if they can afford to buy a home, some worry that the prices are artificially high and can't be sustained, while others don't want to stop enjoying life just so they can spend all their money on house payments. Still others complain that the only houses they can afford are too small, too ugly or too far away for a reasonable commute. They have expectations, and most affordable options in the Washington region don't meet them. As a recent Washington Post article observed, there is a "missing middle" of affordable starter homes in cities across the country, and some cities are moving faster than others to relax zoning restrictions and encourage the development of smaller-and cheaper-single family options.
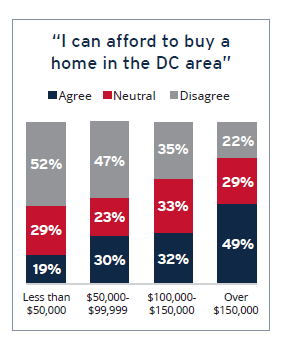
Overall, only 39% of Millennials we surveyed with household incomes over $100,000 per year feel they can afford to buy a home in the Washington area. According to an analysis by HSH.com, a resident in our region needs a salary of $84,503 to afford a home, and that’s on top of a 20% down payment – $80,000 for the median home. Looking at it this way, Washington lands in the middle of the top 20 cities. Compared to the cities in California, Washington looks like a bargain. But there are many more affordable cities on the list, plus other smaller cities where a family could live comfortably on just one income. In fact, of the top 50 metro areas in the country, there are 11–including Louisville, Cleveland, Memphis, Indianapolis and Cincinnati– where someone could by a house with less than half the salary needed in Washington.
Although house prices are the main focus of frustration we see, "housing costs" includes rent too, and often those are just as challenging. Of the Millennials we surveyed, 19% are living with their parents or grandparents, a higher percentage than Pew's estimate of 15% nationwide. Living at home is a smart money-saving strategy, but over half of the Millennials we surveyed did not grow up here so they do not have the option. The average rent for a one bedroom apartment in the greater Washington area at the end of 2017 was $1,320 per month and a two bedroom was $1,530. Millennials wanting to live in the District have to fork over much more: an average of $2,330 for a one bedroom apartment and $3,060 for a two bedroom.
Millennials choosing to rent in or near the District are just as likely as homeowners to feel the sticker shock of housing prices when they write their rent checks. That may be why the apartment factor in our Millennial Index survey jumped from 19th out of 33 last year to 12th this year. Almost 40% of respondents deemed apartment availability (and their ability to shop around) extremely important, up from just 26% last year. Millennials are likely faced with little choice when it comes to affordable apartments, since Zillow estimates that over half the apartments added to the region from 2014 to 2016 were high-end units, driving up demand and prices for the affordable lower-end units.
As Millennials head toward marriage, plan to have children and start thinking about saving for retirement (all of which happens when they move into their thirties), housing will become an even bigger frustration. Unless Millennials are comparing Washington to big cities on the west coast, this region seems like an expensive place to settle down, especially if they want to stay within a reasonable commuting distance from a downtown job. As noted above, we are already seeing net out-migration and should expect to see even more Millennials fleeing to affordable locations over the coming years. Two-thirds of Millennials in our survey who plan to move in the next few years say they want to move to a more affordable city, and the number jumps to 74% among Millennials living in the District and Arlington.
| City | Median Home Price | Index to National Average | |
|---|---|---|---|
| Source: Bureau of Labor Statistics | |||
|
San Francisco |
$900,000 |
354% |
|
|
San Diego |
$607,000 |
239% |
|
|
Los Angeles |
$595,100 |
234% |
|
|
Seattle |
$478,500 |
188% |
|
|
Boston |
$464,100 |
183% |
|
|
New York |
$419,100 |
165% |
|
|
Denver |
$418,100 |
165% |
|
|
Washington |
$408,500 |
161% |
|
|
Miami |
$340,000 |
134% |
|
|
Riverside |
$339,900 |
134% |
|
|
Minneapolis |
$257,800 |
101% |
|
|
Chicago |
$255,600 |
101% |
|
|
National |
$254,000 |
100% |
|
|
Dallas |
$249,000 |
98% |
|
|
Phoenix |
$248,900 |
98% |
|
|
Philadelphia |
$238,900 |
94% |
|
|
Houston |
$233,900 |
92% |
|
|
Tampa |
$225,000 |
89% |
|
|
Atlanta |
$204,300 |
80% |
|
|
Detroit |
$183,040 |
72% |
|
|
St. Louis |
$176,500 |
69% |
|
| City | Salary Needed to Buy a Home | Average Annual Salary | # of Average Salaries Needed |
|---|---|---|---|
|
San Francisco |
$171,331 |
$69,110 |
2.5 |
|
San Diego |
$116,120 |
$55,480 |
2.1 |
|
Los Angeles |
$115,069 |
$55,650 |
2.1 |
|
New York |
$99,151 |
$61,790 |
1.6 |
|
Miami |
$71,799 |
$46,160 |
1.6 |
|
Seattle |
$93,418 |
$61,170 |
1.5 |
|
Boston |
$97,465 |
$64,080 |
1.5 |
|
Riverside |
$67,750 |
$46,820 |
1.4 |
|
Denver |
$79,459 |
$55,910 |
1.4 |
|
Washington |
$84,503 |
$68,000 |
1.2 |
|
Dallas |
$59,518 |
$50,350 |
1.2 |
|
Chicago |
$62,731 |
$53,320 |
1.2 |
|
Tampa |
$49,474 |
$45,510 |
1.1 |
|
Houston |
$56,600 |
$52,870 |
1.1 |
|
Philadelphia |
$56,195 |
$53,450 |
1.1 |
|
Minneapolis |
$56,245 |
$55,010 |
1.0 |
|
Phoenix |
$48,426 |
$47,540 |
1.0 |
|
Atlanta |
$43,388 |
$50,720 |
0.9 |
|
St. Louis |
$40,822 |
$48,240 |
0.8 |
|
Detroit |
$42,329 |
$50,960 |
0.8 |
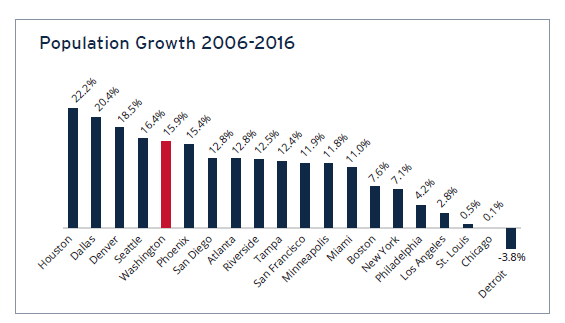
Last year, the most uniform opinion in the entire Millennial Index survey was about traffic: 80% agreed that it was horrendous. This year, we asked if traffic was getting worse every year and 64% agreed. Perhaps it shouldn't come as a surprise that traffic has been getting worse since the population in the Washington area has increased by 16% over the last 10 years while most highways have not expanded. Los Angeles, which has historically topped the list of worst traffic, grew its population less than 3% over the same time period.
The fifth most important factor in the Millennial Index is ease of commuting, which is highly correlated to traffic since 60% of Washington area Millennials drive to work often or always. Even those who use Metro or telecommute are bothered by traffic, which is increasingly prevalent on the weekends and outside of rush hours. Over half of Metro riders and telecommuters who are planning to leave the area within the next five years say they want to move to a place with less traffic.
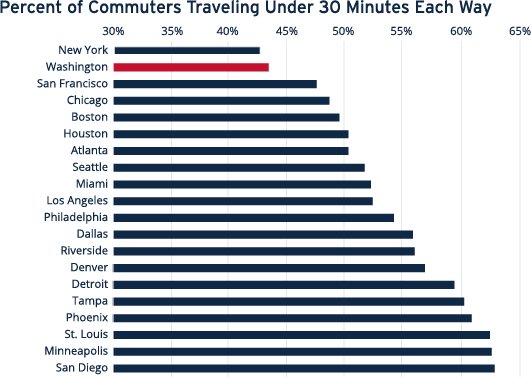
Among the top 20 cities, Washington continues to have the second longest commute times after New York. A big difference, however, is that 47% of New York commuters take public transit to work, versus only 28% for Washington. Not only are New Yorkers able to be productive while commuting on trains, buses or ferries, they avoid the daily frustration of accidents, lane closures and aggressive drivers. There is a substantial gap in commute times between Washington and all the other cities on the list, so Millennials are correct thinking that moving could ease their commuting woes.
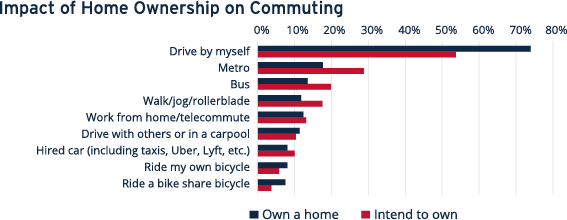
In his paper about the region's declining economic situation, Dr. Fuller notes that the Washington region has the highest percentage of non-resident workers among the top 15 metro areas. High housing costs within the metro area (which consists of the District, five counties in Maryland, two counties in West Virginia and 11 counties and six independent cities in northern Virginia) have been pushing people further away from the city, exacerbating the traffic congestion with more commuters on the roads. As Millennials get older and buy houses they often leave the crowded and expensive close-in areas like the District and Arlington to head out into the suburbs and exurbs. The Millennials we surveyed who already own a home are much more likely to be driving by themselves to work than those who are renting. Unfortunately, we would expect traffic and commuting to get worse as more Millennials follow the path to home ownership.
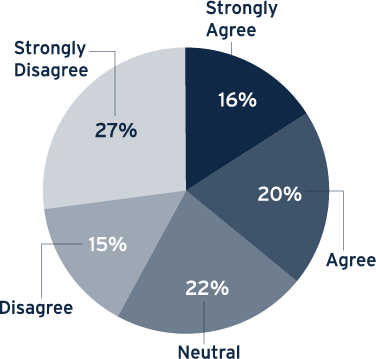
The final piece of the traffic puzzle is Metro, oft-maligned for its poor reliability and high fares relative to the subway systems in other major cities. After a year of Safe Track improvements, we asked Millennials whether they thought Metro was getting better. Only 25% of those we surveyed agree that Metro is getting better while 39% disagreed. Alas, there is not a major change of opinion among Millennials. However, the news is better when we look only at those who regularly commute via Metro. Among this group–who have daily experience to base their opinions on–44% agree that Metro is getting better and only 27% disagree. This may be good news (assuming the word gets out that Metro really is improving) because 39% of the Millennials in our survey who commute over 30 minutes each way said Metro was a feasible option for them but they don’t use it because it is too unreliable and/or expensive. Increased Metro usage may be critical to changing Millennial’s satisfaction with Washington: 45% of those who Metro to work or telecommute regularly say they love DC and plan to stay here forever, compared to just 28% of those who drive often or always.
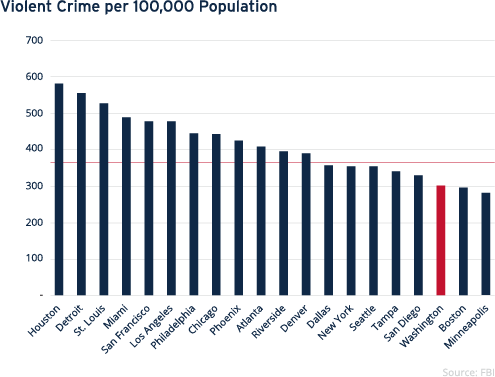
Over the three years of our Millennial Index research, the crime rate has consistently scored as one of the top five most important factors out of more than 30. It is unclear if this is based on personal experience with crime in Washington, a perception that there is a lot of crime here, or just a basic belief that one should consider the crime rate when deciding where to live and work. When asked if they are concerned about crime in the area, 33% of Millennials agreed this year, down substantially from 39% last year. The respondents most concerned about crime are the ones who are least likely to be in affluent areas: Millennials without a college degree and those in Prince Georges and non-border counties. Millennials with children also show higher concern over crime, regardless of where they live.
This year we were able to get crime data covering complete metropolitan areas (city centers plus suburbs), providing a more accurate comparison than our previous studies. When compared this way, the Washington region has among the lowest per capita crime rates of all major cities, helped by its relatively small urban center and its large proportion of suburbs and exurbs.
Given the relatively low crime rate across the region, it is somewhat surprising that the crime rate continues to be so top-of-mind for area Millennials. One reason is what we termed “The DC Dilemma”–the need to tradeoff crime, affordability and an easy commute. Millennials who want easy access to the city but need affordable housing are living in more transitional areas that tend to be (or feel) less safe. There are many very safe areas in the region, but they are either far from downtown or very expensive. Indeed, 62% of Millennials who ranked cost of living as their most important consideration say the crime rate is very important—twice the rate of other Millennials.
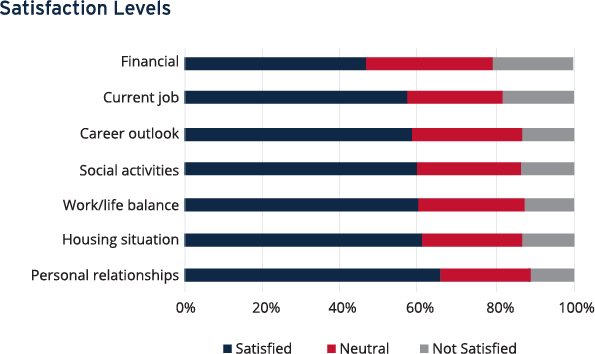
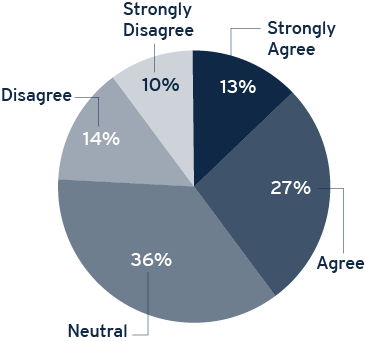
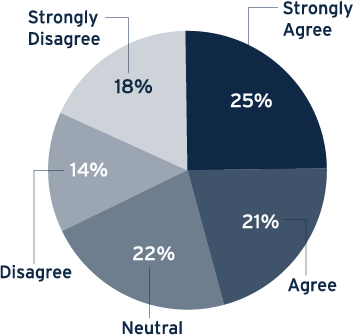
During the first two years of Millennial Index research we read vehement complaints about costs, housing and other aspects of life, yet the region scored very high on attractiveness. In this year’s survey we added a question about satisfaction to better understand the depth and breadth of any discontent. The verdict? The majority (59%) are content and another 15% are only dissatisfied with one item on the list.
Still, not everyone is happy and 13% are dissatisfied with three or more aspects of their lives. One hypothesis is that money makes the difference–those with higher incomes have more freedom, more choices and less pressure–but the data does not show any significant increase in satisfaction among those with household incomes over $100,000. What seems more likely is that the greater Washington area, with its mix of people, activities, jobs, costs, housing options and career opportunities, is a better fit for some Millennials than others.
For instance, Millennials who rank Career or Amenities as the most important category when deciding where to live and work are more satisfied on every measure. Most of them came to Washington specifically for a job and many of them have advanced degrees and high incomes. Washington was a conscious choice for them and they are satisfied with what they find here.
At the other end of the spectrum, Millennials who rank Affordability as their number one priority are less satisfied with every aspect of their lives. Millennials focused on affordability are less likely to have a college degree, more likely to be living with parents or grandparents and more likely to be single. Over 80% of them have household incomes of less than $100,000 and many of them are minorities. In general, this group is not tapped into the professional career trajectory of college graduates so they likely look ahead and see escalating costs without the hope of a corresponding escalation in income.
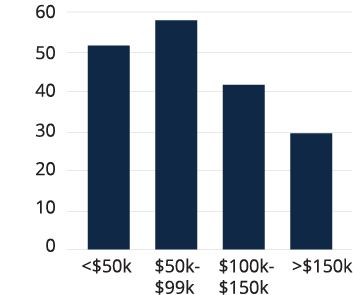
Not surprisingly, financial satisfaction is the lowest of all the measures, but 47% still report being satisfied. That number rises to 58% of those with incomes over $100,000, but that still leaves many Millennials either unsure or unsatisfied. As we observed last year, many high earning Millennials see a lot of money coming into their households but an equally high amount flowing back out, leaving them perhaps more frustrated that they are not getting ahead than those who don’t earn much in the first place. Indeed, among Millennials with household incomes over $100,000 per year, 37% agree that it’s hard to make ends meet even with a good salary, 33% agree that they work hard but can’t seem to get ahead financially and 26% say they basically live paycheck to paycheck. Financial satisfaction goes up when Millennials move from being single (40% satisfied) to a dual-income household (58%) but goes down again when kids – and child care costs – enter the picture (45%).
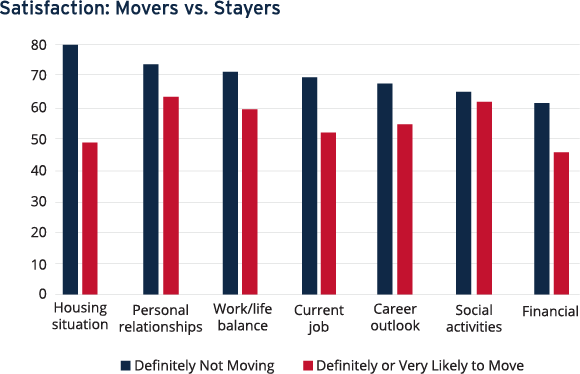
A final note on satisfaction, which Google defines as “the fulfillment of one’s wishes, expectations or needs:” satisfaction does not necessarily mean happiness. Many Millennials come to Washington to get experience or build their careers, so they cope with the high cost of living and long commutes that go with metropolitan living. Millennials who are definitely or very likely to move in the next three to five years do not show huge differences in satisfaction versus those who are definitely going to stay, aside from the housing situation. Many of those planning to move report being basically satisfied with life in the greater Washington area. They have made peace with the tradeoffs, at least for now.
"Even with a good salary it's hard to make ends meet"
"I work hard but I can't seem to get ahead financially"
“It’s too expensive to stay here permanently”
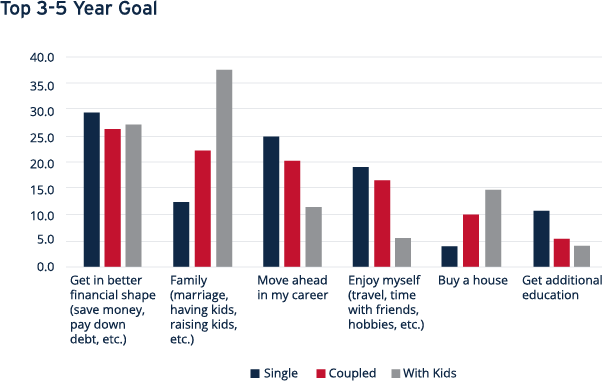
Goals are related to satisfaction; people who are unsatisfied are most likely trying to improve their situation. It’s no surprise then that the top goal among the Millennials we surveyed is to get in better financial shape: 29% ranked it their first priority and another 24% ranked it second. The interest in getting in better financial shape (ranking it first or second out of six options) is fairly universal across everyone we surveyed and includes 37% of those with household incomes over $150,000 per year, 52% of those who have zero student loan payments and 47% of those who already own a home – groups you might think have their finances in order. On the flip side, only 64% of those who say they live paycheck to paycheck said getting in better financial shape was their first or second goal.
The second highest goal involves family, whether getting married, having kids or raising kids. Just over half the respondents ranked it, mostly as their first or second priority, but 48% didn’t count it among their top three goals. Clearly there is a divide between Millennials who are in the “settling down” life stage versus those who are not. In fact, the biggest differences between any sub-groups we analyzed show up when comparing single Millennials to those who are coupled without children and those who have kids already. Getting in better financial shape is universal, but family and house rise in importance while career and personal enjoyment go down as Millennials’ family situations change.
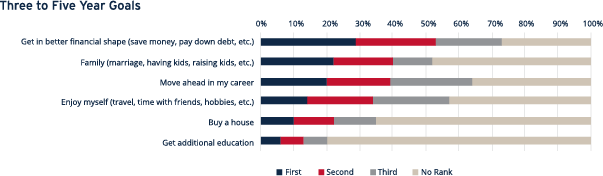
Two other interesting notes on goals: first, 40% of Millennials who have no student loan payments rank “enjoy myself” as their first or second goal, versus only 28% of those who do not have student loans. Most of the student loan payments reported in our research do not seem overly burdensome given the high salaries in the Washington area, but this statistic shows there is some effect. Millennials with student loans hanging over them can’t focus on enjoying themselves to the same degree as others. Second, there is no meaningful difference in goals between Millennials planning to stay in the Washington area and those who are definitely or very likely to leave. This reinforces the notion that movers and stayers are not fundamentally different in what they want, but they are making different plans to get there.
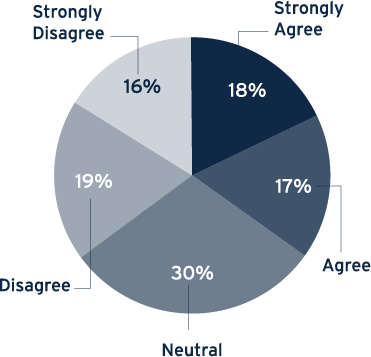
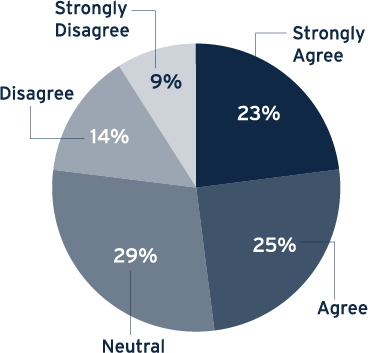
Where to live is a complicated question and Millennials know they have many options. Travel and communication is easy, so there’s no need to stay in one spot throughout their lives. Consistent with last year’s findings, two-thirds of Millennials we surveyed say they are open to moving out of the area for the right job. Only 28% of respondents say they love DC and plan to stay forever. In order to better understand why Millennials stay or move, we asked them a variety of questions on the subject. Of those we surveyed, the split was roughly even between those planning to move in the next five years (54%) and those planning to stay (46%).
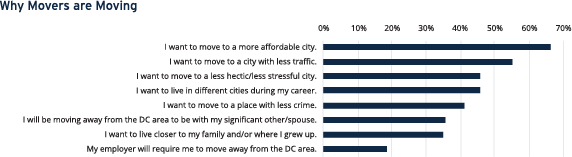
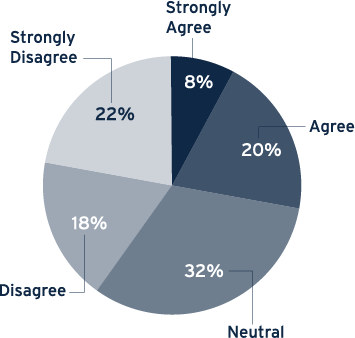
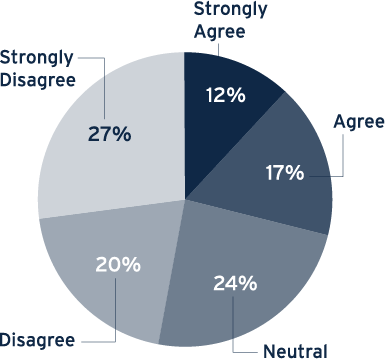
Given the feedback we’ve received about the negatives of living in the Washington area, we wanted to understand if Millennials like the area but are being pushed away (feeling they can no longer cope with high costs and traffic, for instance) or if they are being pulled away to a dream location or somewhere closer to family. The first question we asked the movers was whether the Washington metro area was pushing them away or whether they were being attracted to another location. Almost twice as many (43%) said they are moving to another location versus away from Washington (23%). The remaining third landed in the middle, feeling the push and pull equally. Still, when asked how much they agreed or disagreed with various statements about why they may want to leave, 67% agreed that they want to move to a more affordable city, 55% said they want to move to a city with less traffic and 46% said they want a less hectic and stressful city. While those factors may not be directly pushing Millennials away, they are certainly contributing to the relative attractiveness of other places.
Looking at the full list of statements, it’s clear that many Millennials have reasons to move away that are unrelated to Washington’s challenges. Forty-six percent want to live in different cities during their careers, a wanderlust that is even higher among uncoupled Millennials. Another 36% say they will be moving away to be with a significant other or spouse and 35% want to live closer to their family or where they grew up. It’s not surprising, perhaps, that 45% of those intending to move agree that Washington is “a great stepping stone for my career, but not a place to stay long-term.”
When asked specifically where they are planning to move and what makes that location better, the Millennials we surveyed mentioned quality of life issues as often as affordability. They want mountains, beaches, fewer crowds, nicer people, a slower pace, less crime, warmer weather and a better music/theater scene. California, Colorado, Texas and the Carolinas came up often. At the same time, Millennials leaving Washington still want many of the great amenities they enjoy here–progressive people, plentiful jobs, good salaries–and they believe moving will get them a better mix of everything they want.
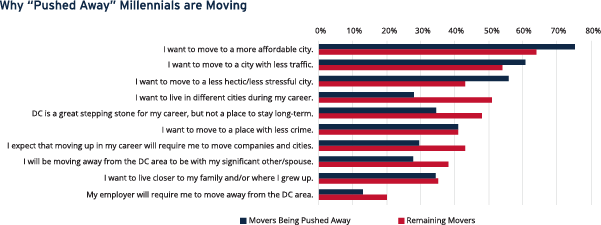
For some Millennials, Washington appears to be “Mr. Right Now” rather than “Mr. Right,” something that is no doubt common for many large cities. But the question remains whether there are some Millennials who would like to stay in the Washington area but just can’t see how to make ends meet. We looked at the Millennials who said they were being pushed away, compared to those being pulled away, and found some stark differences. “Pushed away” Millennials are much more likely to be seeking a place that is more affordable, less hectic and with less traffic. At the same time, they are less likely to see the Washington area as just a stepping stone or one of many cities they want to experience during their careers. They definitely feel priced or paced out of the area, and almost half say it’s upsetting to think about moving away from their friends and family here. This group, which comprises 12% of the Millennials we surveyed, are the ones who would love to stay if they could afford to.
Similar to movers, we asked Millennials planning to stay in the area for the next five years why. The number one reason is contentment: 74% say they are content with their lives, so the mix of amenities, housing options, employers and people are a good fit for them. Jobs (their own or their spouse’s), friends, family obligations and good schools for their children are each an important reason to at least 40% of all non-movers. Even the inertia reason–it’s too much work to move–is good news for the Washington region because it means that nothing is so horrible in their lives that it’s worth finding a new city to move to.
We also asked non-movers to tell us what might entice them to move away from the Washington region. Over two-thirds said a better job or a higher salary would make them consider leaving and one-fifth said they would move away for family reasons, such as finding a significant other who wants to move or needing to help an older parent who lives elsewhere. Fifteen percent said they might move to find a lower cost area (usually provided that they could maintain their current salary) or that they might be pushed away if costs continue to rise.
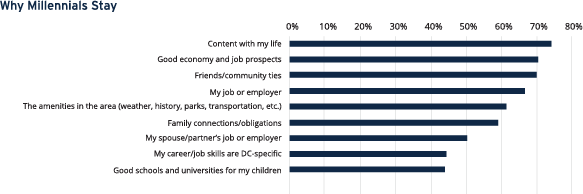
A handful of respondents specifically mentioned winning the lottery as a reason they would leave, which may seem counter-intuitive since more money would solve their affordability woes. Instead, what it speaks to are the many people who live in the Washington region for jobs and high salaries, and if they didn’t have to work they would move someplace more enjoyable, probably a sunny, uncrowded beach or a mountainside cabin. After all, only 38% of non-movers agree with the statement, “I love DC and plan to stay here forever.”
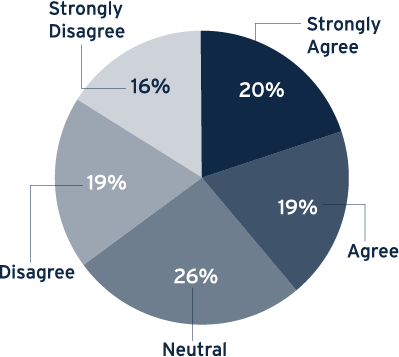
Understanding that moving versus staying can be fluid and depend on a constant reassessment of myriad factors, we asked every Millennial we surveyed to go through a tradeoff exercise to see what might persuade them to stay in the area. Perhaps not surprisingly, the top answer was a higher salary, but overall it only garnered a 14% share of preference. “Having a job that I enjoy” came up second with a 12% share, suggesting that happy employees might be willing to tolerate more of the challenges that come with living in the Washington area than unhappy ones. The next two, which together capture 19% share of preference, are a lower cost of living and more affordable houses. So, three of the top four have to do with the financial cost/benefit equation of living and working in the DC metro area.
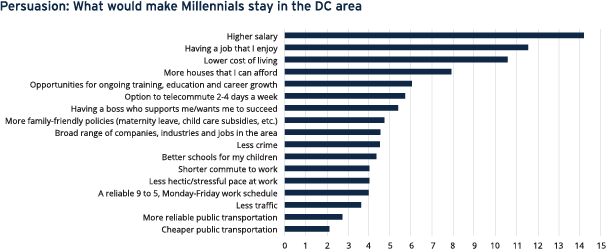
The next highest scoring items have to do with job satisfaction, whether it’s growth opportunities at work, telecommuting regularly (thus saving the commuting time each way), having a supportive boss or having more family-friendly policies. It’s interesting to note that all of those ranked higher than less crime, a shorter commute and less traffic, items we hear complaints about often and are rated among the top five most important factors in the Millennial Index. The least persuasive items on the list have to do with public transportation. It’s not surprising that a cheaper or more reliable system would not influence many decisions, since 60% of the Millennials we surveyed are driving to work rather than taking Metro or a bus.
An overview of the responses
DC is a manageable, highly livable mid-size city
It’s too stressful to stay in the DC area permanently
My commute is killing me
Telecommuting is a viable option for my job
I basically live paycheck to paycheck
I work hard but I can’t seem to get ahead financially
I don’t love my job but I can’t afford to quit
Washington, DC, and its surrounding area remains attractive to Millennials, but that doesn’t mean they will stay in the region forever. Many of the highly educated, career-focused Millennials are ready, willing and able to move for a better job, a higher salary or a chance to try something new. Those at the other end of the spectrum–with lower incomes and fewer prospects–have been watching costs rise along with the city's popularity and know that they will eventually be forced to leave to make ends meet. The tide of Millennials into the Washington area, which has been slowing over the past few years, may now be at an end. The city continues to have high salaries and great amenities, but the lack of affordable starter homes and worsening traffic is potentially transforming Washington from a highly livable mid-size city into an expensive career stepping-stone on the way to settling down somewhere cheaper, safer and less hectic. The majority of Millennials living in the Washington area are content, and with the right incentives from their employers (increasing salaries, support and challenges at work, family-friendly policies, better commuting options) many can transition from single to settled without moving away.
The Kogod Greater Washington Index: Millennials was conceived in 2015 to address two key questions for business and government leaders in our region:
To answer the first question, we created a list of work and lifestyle items based on previous studies of Millennial habits and interests, then surveyed Millennials living in the greater Washington area to determine how each of these items affects their decisions on where to live and work. The items were grouped into five major categories–Jobs, People, Amenities, Affordability and Career Options–and respondents were asked to rate the importance of each item and each category. They were also asked to rank the major categories in order of importance, forcing them to differentiate even if they felt all the items were of equal importance.
To answer the second question (How does the greater Washington area measure up to Millennial needs?), we compiled objective data on every factor in the index and calculated how the greater Washington area stacks up against the national average. By comparing the importance of each item to the greater Washington area’s ability to deliver what is desired (a low crime rate, a short commute or high salaries, for instance), we begin to see where the region is satisfying Millennial needs and where it’s falling short.
The Millennial index is a single number designed to summarize the attractiveness of the greater Washington area to Millennials. It provides a quick snapshot to compare the region’s performance from year to year and against other large metropolitan areas in the US. The Millennial index is comprised of scores for each of five major categories – Jobs, Affordability, Career, Amenities and People – and for five to eight individual factors (33 in total) that make up each category. For each factor, we determined both an importance score and a delivery score, then aggregated the values based on their relative importance to greater Washington area Millennials.
Rating of how important each factor and category is to greater Washington area Millennials, derived from survey data. Maximum score is 100.
Assessment of how well the greater Washington area is delivering against the factors and categories, calculated from publicly available data on the Washington, DC, metropolitan statistical area (MSA) compared to national averages. Delivery score is an index, where 100% means the greater Washington area is on par with the nation. Values over 100% indicate the greater Washington area is doing better than the national average while values below 100% indicate the area is doing worse.
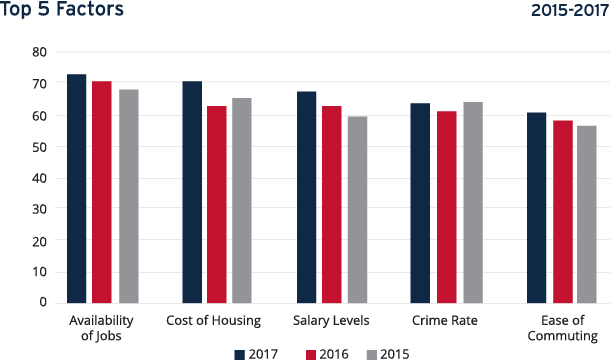
To assess the attractiveness of the Washington area, we ask Millennials about 33 separate factors dealing with jobs, career and education options, cost of living, amenities and the type of people who live in the area. Over the three years of our research, the top five most important factors have remained the same and their importance has generally grown. Together, these five factors make up 29% of the overall index score, about double what their importance would be if every factor counted equally. Clearly, these are the factors of highest concern so anyone interested in better understanding local Millennials or keeping them happy in the region should pay particular attention employment, salaries, job growth, housing costs and crime.
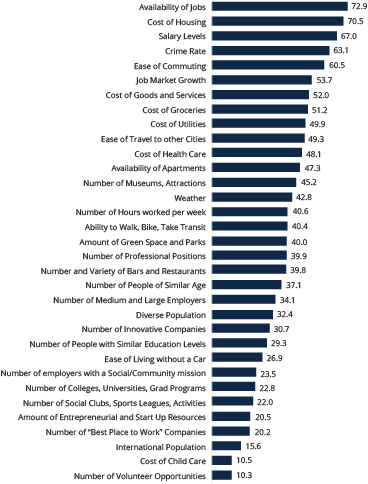
Above are the importance scores for all 33 factors. The two biggest movers this year are both related to housing. Cost of housing pulled ahead of salary levels to become the second most important factor, and apartment availability jumped from 19 on the list to number 12. Consistent with prior years, most of the Amenities factors fall in the middle–important but not the most important–and all of the People factors show up in the bottom half. The Affordability factors all make the top third of the list except for the cost of child care, which is irrelevant to a large segment of our respondents, thus pushing its overall importance to the bottom.
The Kogod Greater Washington Index: Millennials was created using publicly available data weighted based on survey responses from a representative pool of greater Washington area Millennials. The survey was conducted by Prizma Research in the fall of 2017. It was conducted online via computer, tablet and mobile devices. Five hundred and two (502) responses were gathered from adults ages 21-35 who are non-temporary residents of the Washington metropolitan statistical area (MSA). Younger Millennials were excluded from the survey to focus on adults with more experience making decisions about living and working in the greater Washington area.
The index uses a variety of sources to measure how the greater Washington area compares to other places to live and work in the United States. Whenever possible, the greater Washington area was compared to the total US incidence, average or median. When complete tracking data was not available, the greater Washington area was compared to average values for all cities measured by the source.
The Millennial Index is a weighted average comparison of how well the greater Washington area performs on 33 factors and how important each factor is to Millennials residing in the region. Below is a detailed summary of how the scores were developed.
Importance Score: For each of the 33 factors, survey respondents were asked to rate how important each item was when deciding where to live and work. Ratings were done on a five-point scale from "1 - not at all important" to "5 - extremely important." The importance score was calculated using the percentage of respondents who rated the factor a "5" or "4" discounted by the percentage who rated the factor a "1" for not at all important. This method avoids the common problem of regression to the mean and allows clearer differentiation between the factors.
Delivery Score: The delivery score rates how well the greater Washington area is delivering against the 33 factors. The delivery scores are calculated as an index between the Washington MSA value and the national average (or composite of available cities when national data is not available) for each measure. As with any index, 1.0 (100%) means the greater Washington area is on par with the nation. Values over 1.0 indicate DC is doing better than the national average and values below 1.0 indicate DC is doing worse. For most of the factors, bigger values are better, such as salary levels or amount of parkland. In this case, the greater Washington area value is the numerator and the national average is the denominator. For some factors, smaller values are more desirable, such as crime rate or commuting time. In those cases, the national value is the numerator and the greater Washington area is the denominator.
Factor Weights: To aggregate importance and delivery scores for each major category-Jobs, Affordability, Career, Amenities and People-each factor within the category was weighted based on its relative importance to the other factors in the category. For example, if four factors comprise the category and their individual importance scores are 50, 30, 15 and 5 (totaling 100 points), then half of the category score comes from the first factor, 30% from the second, 15% from the third and 5% from the fourth.
Category Weights: To arrive at an overall score for how well the greater Washington area is doing regarding Millennial desires, the five category delivery scores were combined into a weighted average. The weights (relative importance) for each of the five categories were calculated by combining results from two questions on the Millennial survey-one which required respondents to rank each category according to how important it is, and one which asked respondents to rate the importance of each category on the five point importance scale.
|
Availability of jobs |
Bureau of Labor Statistics |
|
Salary levels in the area |
US Census |
|
Average number of hours people work each week |
Wallethub |
|
Number of innovative companies in the area |
Innovation-cities.com |
|
Number of companies nationally recognized as a "best place to work" |
Glassdoor.com |
|
Number of area employers whose mission includes social and community responsibility |
Bureau of Labor Statistics |
|
Ease of commuting to work |
US Census |
|
The number of colleges, universities and graduate school programs in the area |
Department of Education |
|
The number of medium and large employers |
US Census |
|
Availability of professional positions |
US Census |
|
Resources available to support entrepreneurs and start-ups |
National Venture Capital Association |
|
The growth of the area's job market |
Bureau of Labor Statistics |
|
Number of people similar in age to me |
US Census |
|
Number of people with a similar education level as me |
US Census |
|
Availability of professional positions |
US Census |
|
Diverse population |
US Census |
|
International population |
US Census |
|
Number of social clubs, sports leagues and organized activities to participate in |
Meetup.com |
|
Number of volunteer opportunities |
Corporation for National and Community Service |
|
Ability to walk, bicycle or use public transportation to get around |
US Census |
|
Ease of traveling to other cities or countries via plane, train or bus |
Bureau of Transportation Statistics |
|
Weather |
Best Places |
|
Number of museums, attractions, sports events and things to do |
Institute of Museum and Library Services; TripAdvisor |
|
Amount of green space and park land |
Trust for Public Land |
|
Number of bars and restaurants |
US Census |
|
Crime rate |
FBI |
|
Availability of apartments to rent |
US Census |
|
Housing costs |
Council for Community and Economic Research |
|
Ability to live and get around without owning a car |
Bureau of Transportation Statistics; US Census |
|
Cost of groceries |
Council for Community and Economic Research |
|
Cost of goods and services |
Council for Community and Economic Research |
|
Cost of utilities such as electricity and internet |
Council for Community and Economic Research |
|
Cost of childcare |
Care.com |
|
Cost of utilities such as electricity and internet |
Cost of health care |
|
Cost of childcare |
Council for Community and Economic Research |